
Cybersecurity for Embedded Systems
From medical devices and smart vehicles to industrial controllers and consumer electronics, embedded systems are everywhere—and increasingly connected. But with […]
Join us at Qt C++ Warsaw Meetup - 21.08.2025
Sign up for free!
The Qt Graphs is a powerful module of the Qt framework that enables developers to create interactive, both static and dynamic 2D charts and 3D data visualizations. Although, at first sight, it does not introduce a ground-breaking change, since in general such capability was already present in the Qt framework, namely in the Qt Charts module and Qt Data Visualization, it encapsulates the stated functionalities while introducing numerous improvements and upgrades, both under the hood and those visible at a glance.
With the recent Qt 6.8 release, the Graphs module has officially left the tech preview state, so in this blog post, we will look into the matter and conduct a small reconnaissance on what’s changed, why, and how it’s going to affect the life of a Qt developer.
If your project could benefit from elegant and dynamic visualizations, visit our Qt development services page to see how we can help.
The replaced modules date back to the early Qt 5 era, and over the years, the demand for better performance has grown increasingly evident, driven by the need for modern applications to deliver more efficient rendering and greater flexibility.
The rendering engine in Qt Data Visualization, based on OpenGL, needed to run on devices using OpenGL ES 2, limiting access to advanced OpenGL features. Additionally, it enforced the use of OpenGL for UI components, which, on certain platforms like Windows with its native Direct3D, could result in suboptimal performance.
The Qt Charts module, however, relies on the Qt Graphics View Framework, making it tightly coupled with the Widget framework. This, in turn, induced software rendering in many cases, further impacting operation efficiency.
Qt Graphs addresses a lot of these problems. Its 3D module is based on Qt Quick 3D which leverages Qt RHI (Qt Rendering Hardware Interface) to utilize rendering backend optimal for the target platform, including Direct3D, Vulkan or Metal. Qt Graphs 2D module, on the other hand, employs Quick framework, so it benefits from hardware-accelerated rendering. This combination greatly enhances performance and flexibility.
Another thing that called for a change is 2D and 3D data visualization separation. Graphs combine the Qt Charts module (2D) and the Data Visualization (3D) into one, which is a neat convenience in itself. It is worth noting that in case such separation is desired, for instance, if we’re working with an embedded device with limited specifications, there are means to build only 2D or 3D support into the module.
Interestingly enough, apart from the above, the use of Qt Quick 3D for the Graphs implementation also brings new features to the table. Not only is it now possible to have QQuick3D elements easily integrated into the graphs, but we can also extend the Qt Quick 3D scene environment by defining either SceneEnvironment or ExtendedSceneEnvironment in the environment property. This allows us to configure how a scene is rendered, providing features such as lighting control, background configuration, fog effects, tone mapping, and all sorts of post-processing effects.
Moreover, we can import a Quick 3D scene into the graph by assigning a Node to the importScene property. A Node object represents an entity within the 3D scene and serves as the base class for other spatial types, such as Model, Camera, and Light. Needless to say, this opens up limitless potential for personalizing your graph’s scenery.
I could go on, but for brevity, let me summarize the remaining changes in a concise list below:
Simplified Input Handling: Multiple input handlers (QAbstract3DInputHandler, QInput3DHandler, QTouch3DInputHandler) have been consolidated into a single QGraphsInputHandler. On the 2D side, QuickItem events are now processed directly, eliminating the need for QuickItem to graphics scene event translation.
Improved Data Handling: The API no longer requires heap allocation of new data arrays. Move semantics is used to avoid unnecessary copies. Proxies, instead of storing data, act as intermediaries, immediately passing data to the series.
Widget Compatibility: Widgets can still be utilized, with a caveat that QQuickWidget must be used in place of a plain QWidget.
Themes Overhaul: The Q3DTheme has been replaced with QGraphsTheme, which is split into two logical parts: theme and color scheme. Color schemes have been modernized and offer light, dark and automatic options.
Transparency: Now supported in both Bars3D and Scatter3D.
Optimized Rendering: Model instancing has been introduced for 3D bar and scatter graphs, enabling efficient rendering of large datasets. For surface graphs, vertex positioning, now delegated to the vertex shader, is carried out by the GPU.
<whining>
Not to make it all sound too sweet and flowery, I have to admit that a number of things from the former modules haven’t found their place in the new one yet.
What’s hard to miss when composing a graph, whether that would be 2D or 3D, is the lack of legends and titles. While the lack of a graph title is not that big of a deal to work around, writing your own legend doubles down on the effort required to quickly craft a visualization of data settled in a context.
GraphsTheme seems to be slightly undercooked – it does not always affect the graph’s appearance as you could expect.
Some graphs related properties straight up do not work, or work in a way contrary to the one described in the documentation.
Speaking of documentation, it would benefit vastly from being a bit more verbose here and there, as well as from all the hyperlinks being present and functional. It happened once or twice that I had to resort to the source code to find the possible enum values, being unable to navigate to the corresponding table in the docs.
The source code itself played a debunking role in my Graphs experience, for instance when a signal’s existence was not announced by the documentation, or I could not use a method which, although apparent in the docs, later turned out to be non-existent.
</whining>
Overall, things found in the docs stated to be known issues or missing, as of Qt 6.8 release, include some types of 2D graphs, the mentioned above titles and legends, shadows and transparency of Surface 3D, transparency of Bars 3D and Scatter 3D highlighted items, and a few others.
Bearing in mind, however, that the module is just out of the oven, we can be sure that the development didn’t just stop there and possibly these and other splendid features shall be supplemented by the Qt crew and the contributors sooner or later.
Below are some examples of what you can do using the new module. Much of what you will see here is impossible to achieve with Qt Charts.
Starting with a simple graph with a static data set and a custom point delegate.
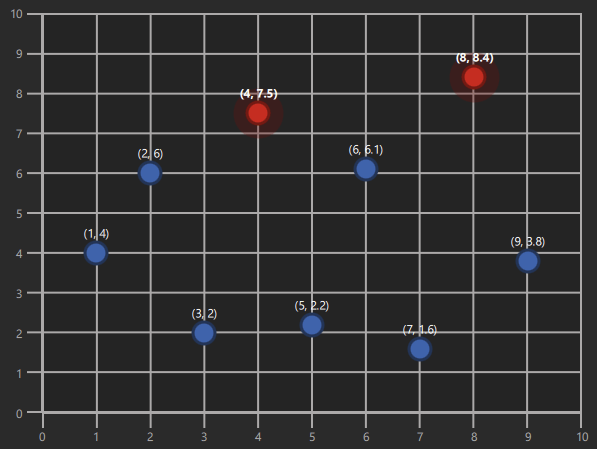 A 2D scatter graph
Outcome bars surpassing their corresponding Income ones get selected. On-appearance animation twist added for show.
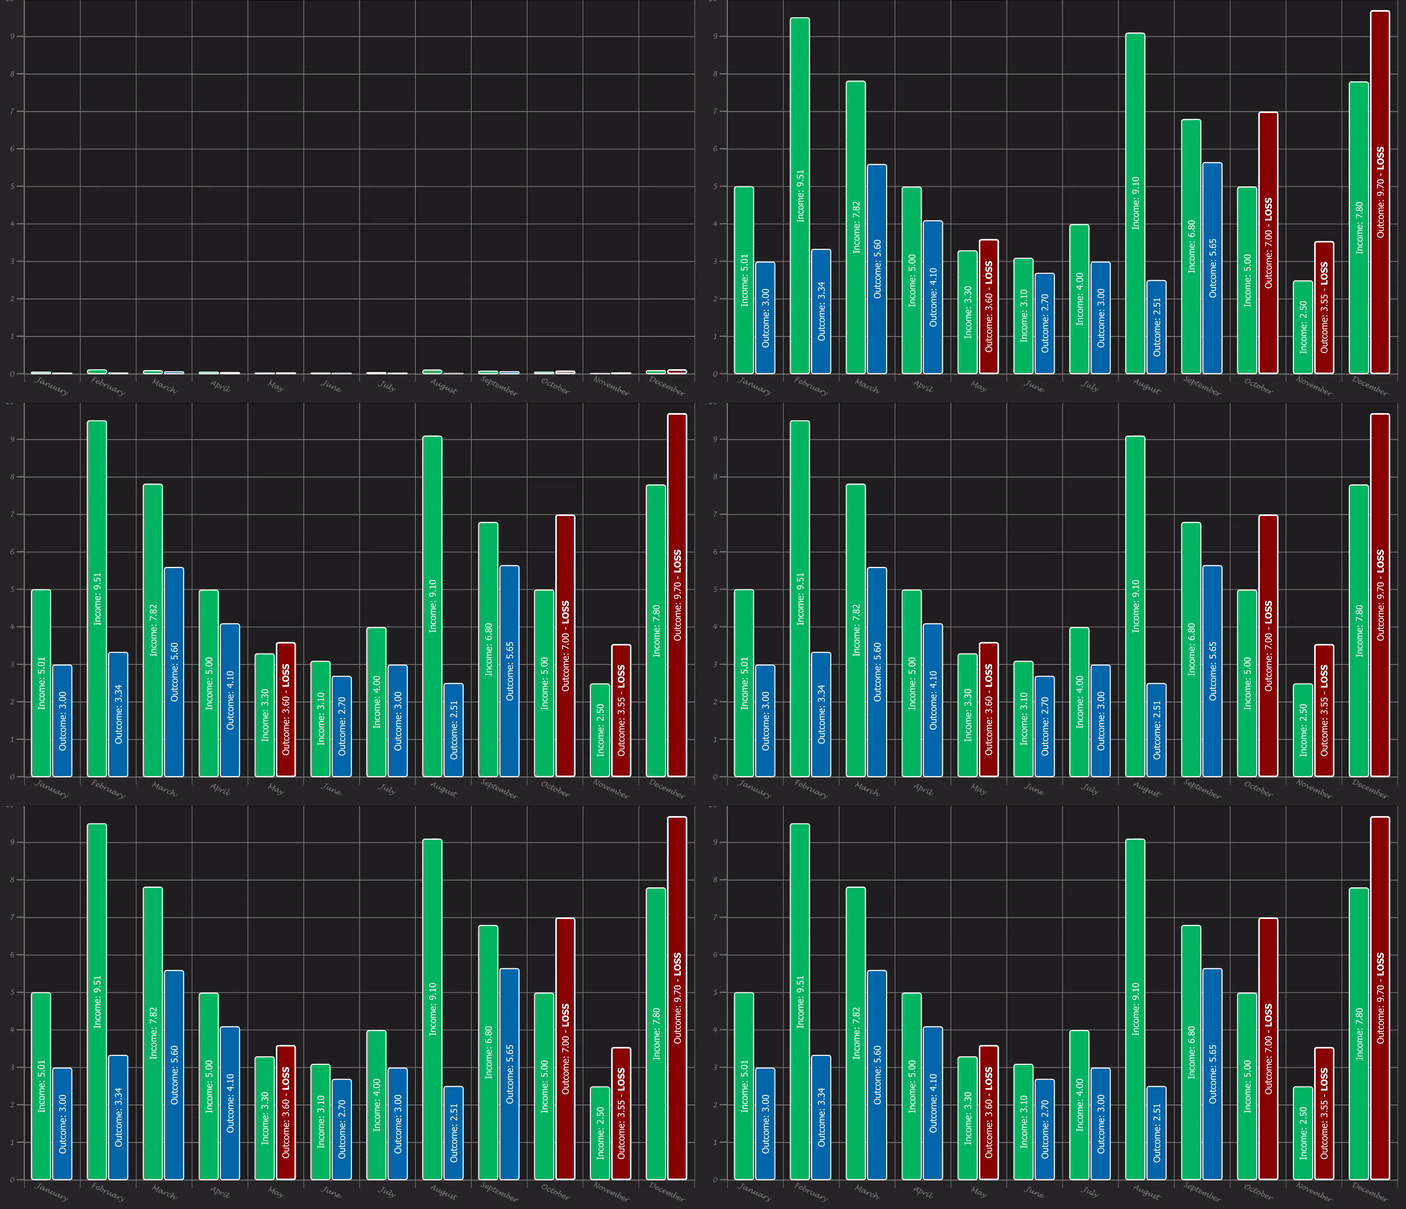 A 2D bar graph
A static area graph. Composing fine-looking data is trickier than I thought.
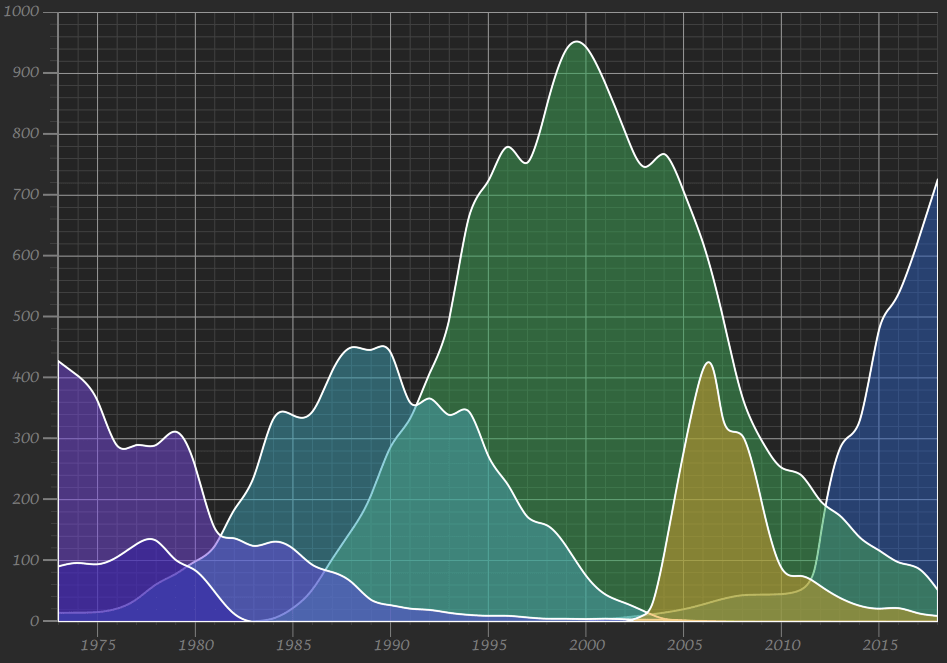 A 2D area graph
A spline graph with dynamically appended points and a custom point delegate. Uses GraphPoint and SplineControl animations. Truth be told, it seems a bit buggy in certain conditions, but treated with enough care, brings quite a neat result.
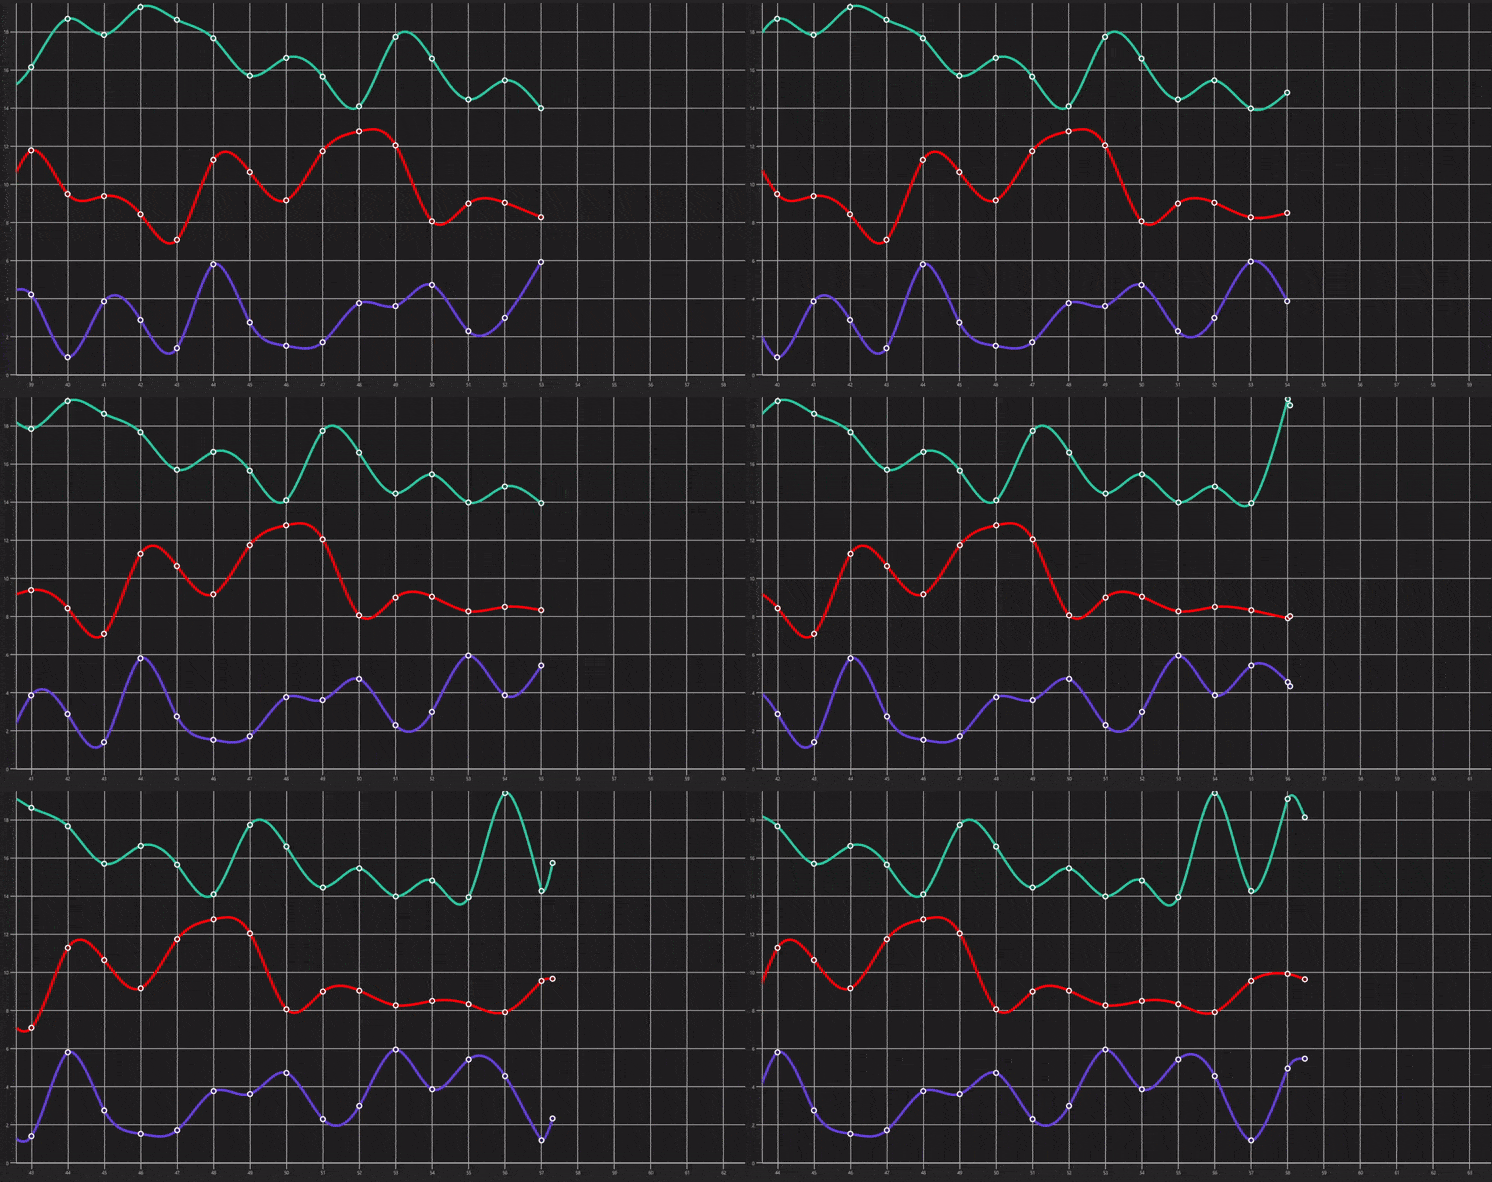 A 2D dynamic spline graph
The graph benefits from ExtendedSceneEnvironment’s glow related properties.
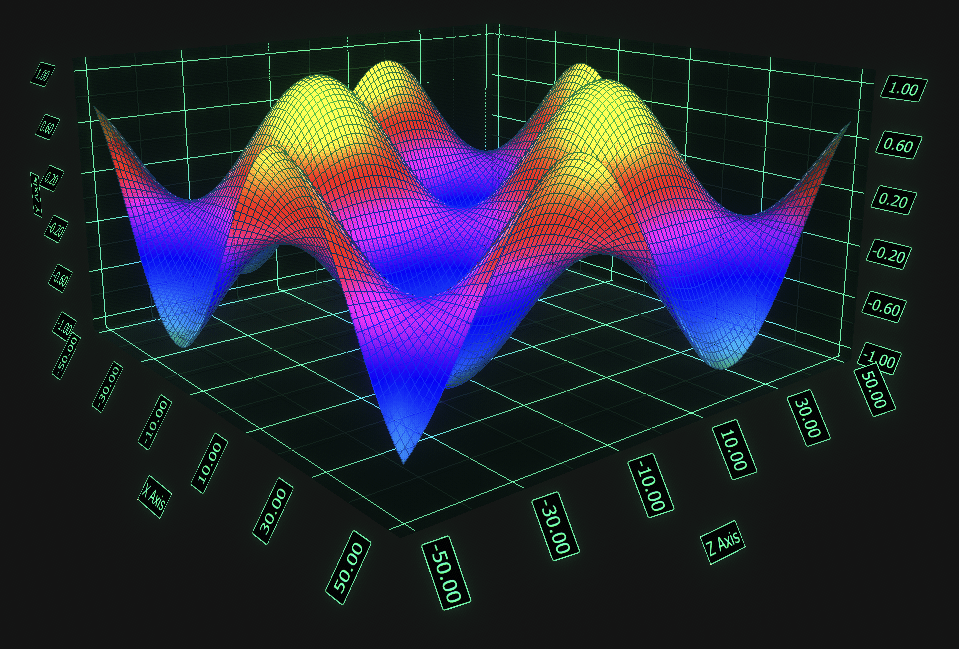 A 3D sufrace graph with a bit of a Quick3D glow
This one was fun, the sphere has been added as a Model inside Node object assigned to an importScene property. Disco vibes come from ExtendedSceneEnvironment’s lens flare effect.
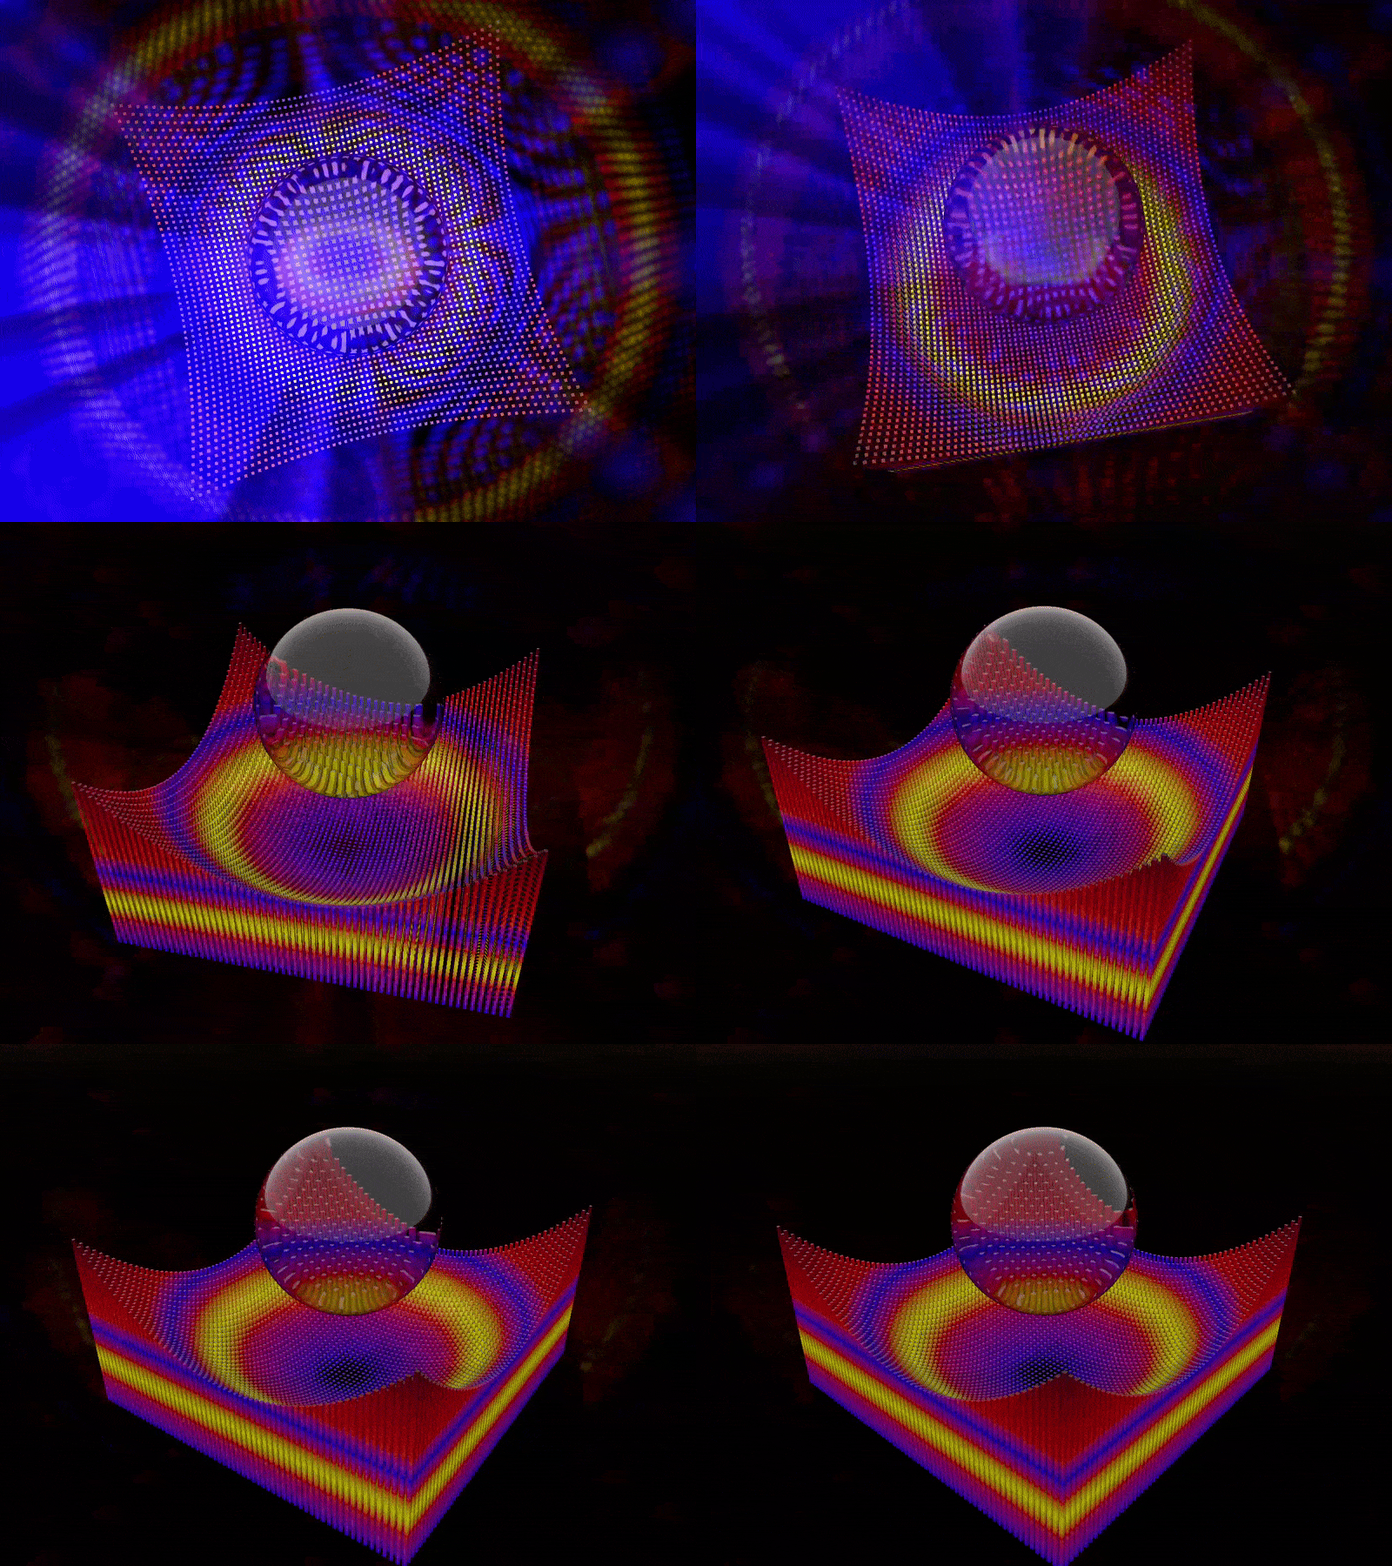 A 3D bar graph with Quick3D scene imported
To sum up, the Qt Graphs module provides an easy and efficient way for Qt developers to visualize data points in both Widget and QML applications. Even with a few things still missing, it already simplifies workflows, reduces dependencies, boosts performance and enables new features, making it a valuable tool in the process of crafting a modern user interface.
Let's face it? It is a challenge to get top Qt QML developers on board. Help yourself and start the collaboration with Scythe Studio - real experts in Qt C++ framework.
Discover our capabilities
From medical devices and smart vehicles to industrial controllers and consumer electronics, embedded systems are everywhere—and increasingly connected. But with […]

Hey, welcome back to another blog post. Today we’re going to talk about the new Qt WebAssembly. This post will […]

Users of embedded devices – from industrial controllers to consumer electronics – are often unaware of hidden vulnerabilities that threaten […]