
Software in a Medical Device (SiMD) vs Software as a Medical Device (SaMD)
Today’s medicine would not be in the same place if software-based solutions were not implemented into it. I’d be tempted […]

The Qt Charts module provides the possibility to display various types of charts in order to visualize data.This module included in the Qt framework, is quite popular as it is possible to use components from this module while working on UI based on either Qt Widgets or QML. The look and feeling of those charts is almost the same regardless of the selected way of UI implementation as it is based on Qt Graphics View Framework.
In the meantime, you can check our Qt development services page.
The Qt Charts module is available in the Qt framework already for quite long time, but the framework itself constantly evolves and it’s being improved all the time, so there were changes made to this framework as well. The newest, long term support (LTS) version of the Qt framework is Qt 6.2 and this version includes most of the changes and improvements.
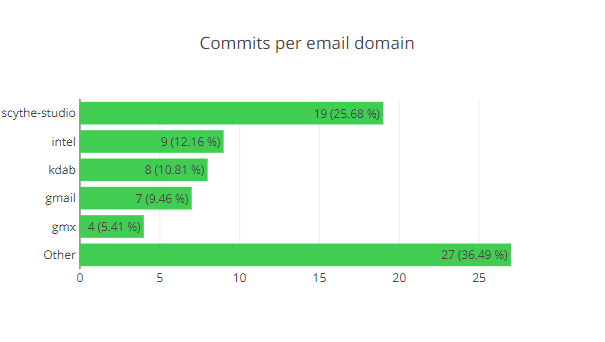
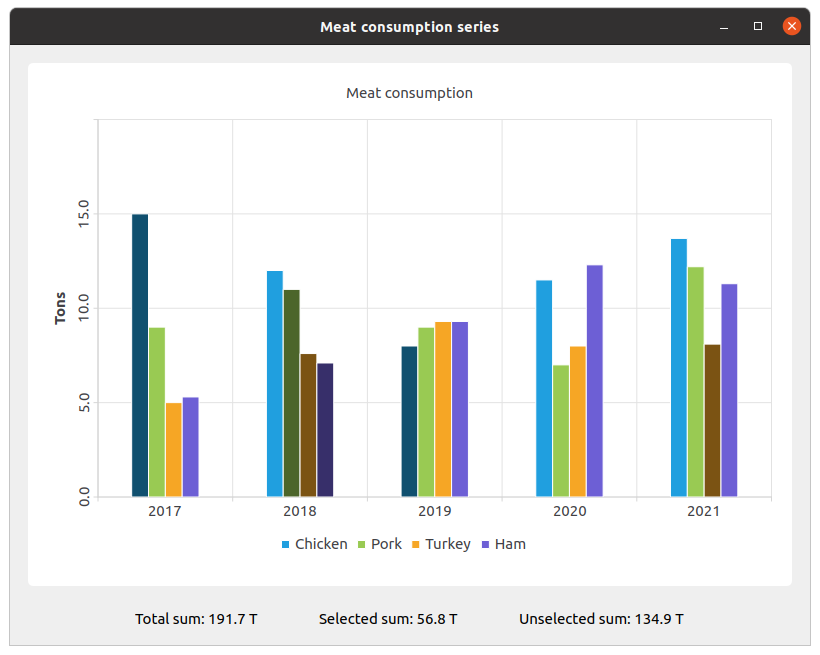
Many of those changes were implemented by Scythe Studio Qt developers, and a bit accidentally we became a significant contributor to the Qt Charts module. The bar chart above shows number of commits per email domain since 2008 except commits from the Qt company employees. Of course number of commits is not the best indicator as some of commits are results of joint work and commits differ from each other. Also Qt employees’ (especially maintainer’s) patience during reviewing deserves a huge appreciation.
The Qt Charts module was restored in Qt 6.1 in the form it was in last versions of Qt 5. In this blog post we’re going to describe only the changes made to the module in Qt 6.2. We’re not going to explain all of the changes like minor changes, documentation changes or new demos. The full list of Qt Charts changes in Qt 6.2 can be found in official release notes.
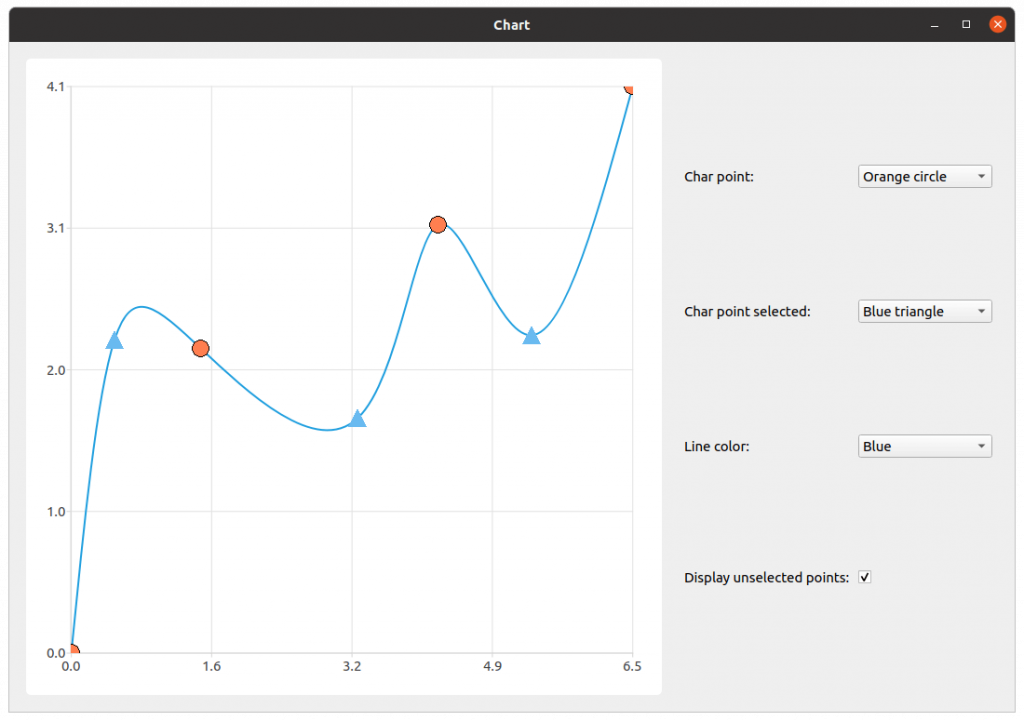
Previously to customize the look of individual points or points that should be drawn you needed to create multiple separate series. To remind, series are sets of points to draw a line between them and/or individual points. Imagine that you wanted to have a more customized look of your charts, for instance you may wanted to display points labels only above some of them. Following the old approach you needed to create two series where one of them would include only points with labels and the other one only points without labels. Then you would need to call setPointLabelsVisible() accordingly.
How does it work now? Among Qt Charts changes in Qt 6.2 there is a concept of points configuration. You can execute a method like setPointConfiguration() on the instance of QXYSeries derived class (like QLineSeries, QSplineSeries or QScatterSeries) to customize the look of a separate point. You can set configuration of a separate point or multiple points in a bunch. Of course you can clear the configuration anytime.
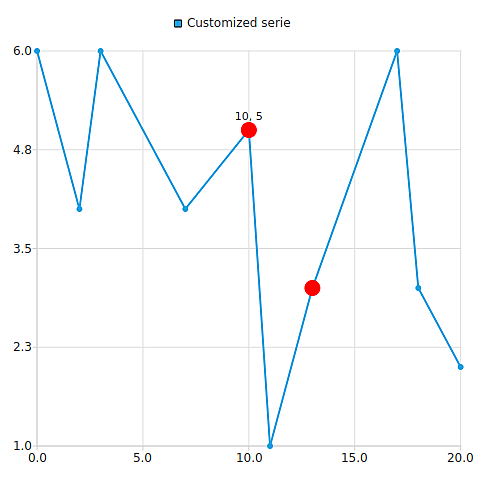
The screenshot above shows the effect that we can achieve using points configuration feature and a single series. It simplifies developers lives as they do not need to fill data into two separate series anymore. With this feature you can customize not only the label visibility of specified points, but also their size, color and visibility.
Some users of Qt Charts module requested to have a possibility to adjust colors and sizes of points by the third dimension. That is the case when you have not only X and Y values, but also Z and you want to for example make a heat map on which points have various colors. To do so, we would need to make significant changes to the API that would require a lot of work. Therefore, it was decided to make usage of points configuration concept and to implement just two methods – colorBy() and sizeBy(). Both take usage of points configuration setting the configuration accordingly to the passed list of values. You can additionally pass the gradient to be used for points colorizing in case of colorBy() method and minimum and maximum size in case of sizeBy() method.
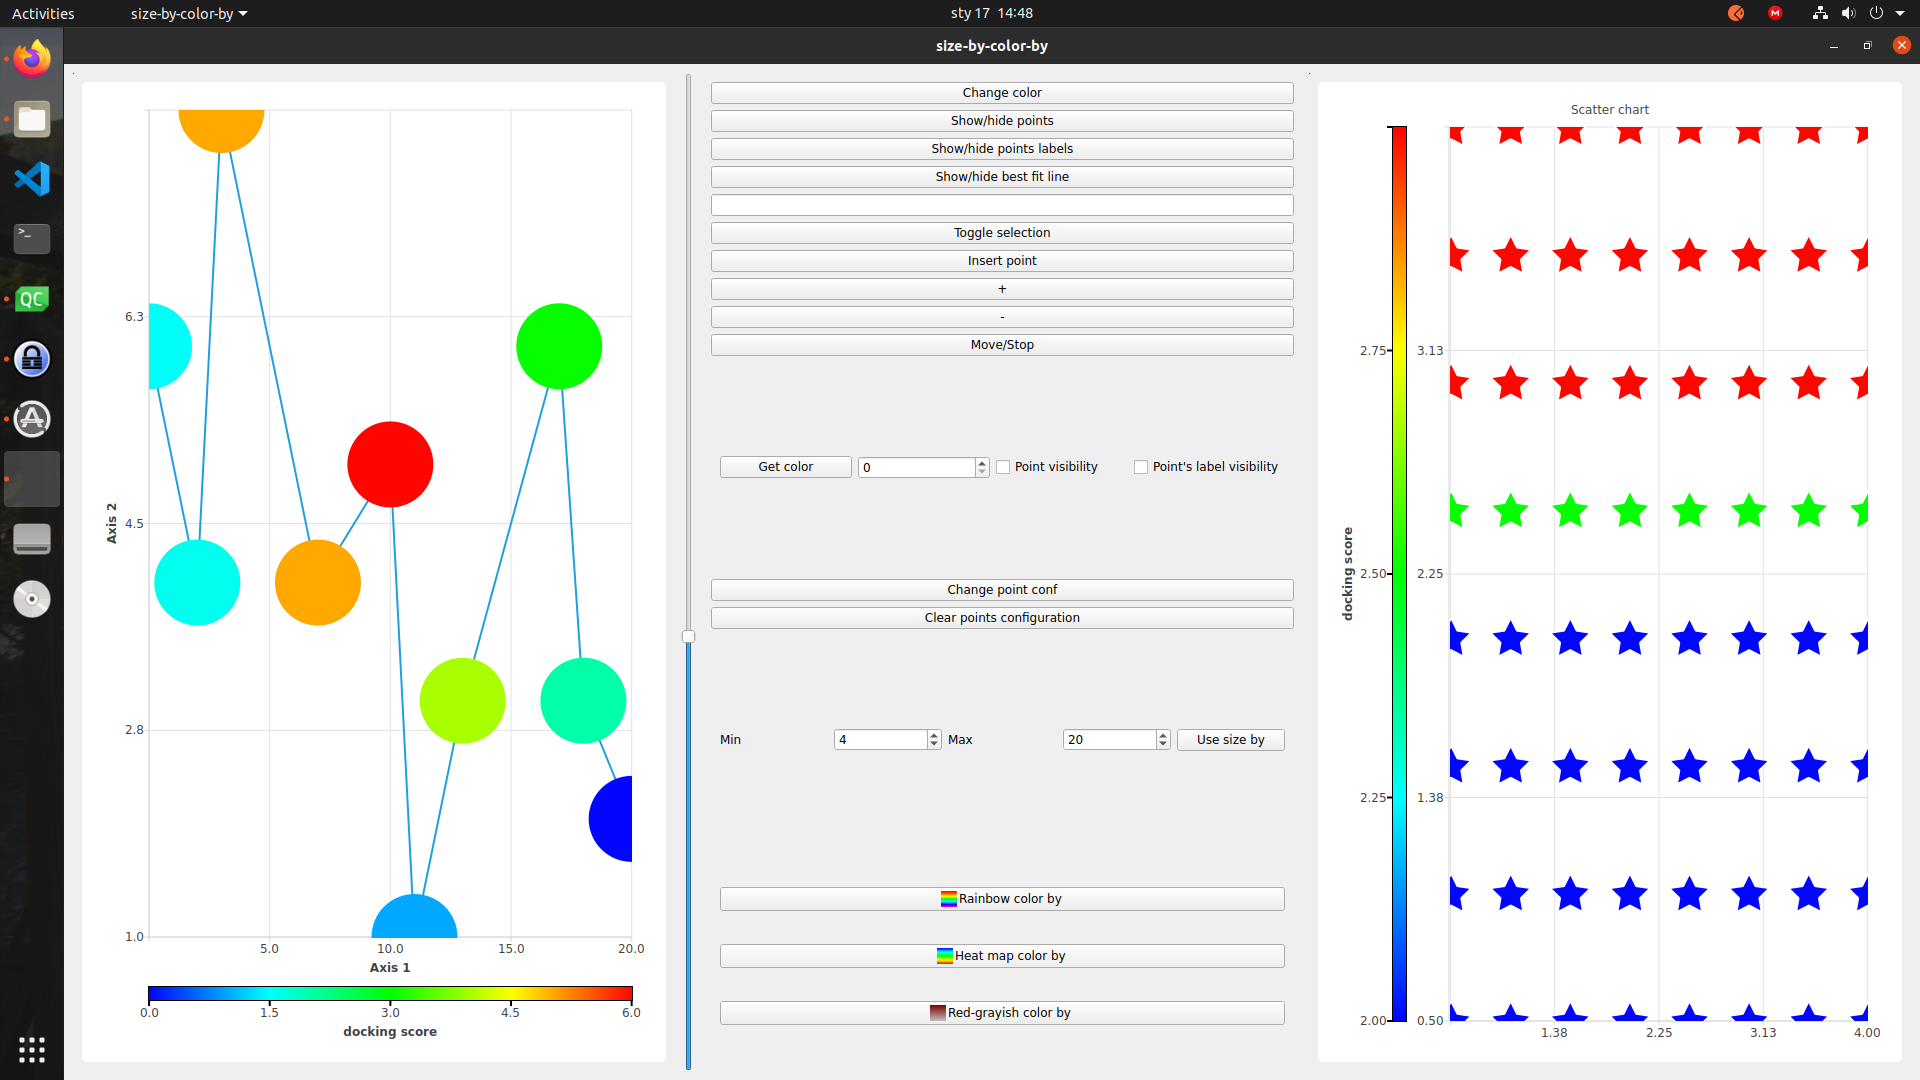
Additionally, there was a new QColorAxis class added to make it more clear what value is represented by particular color.
Some Qt Charts module users requested to have a possibility to highlight some of the points or bars on a chart as it’s quite common for interactive plots. Therefore we implemented a possibility to mark chosen points or bars as selected and adjust their look. Check the documentation of that feature for QXYSeries and QBarSet and try it on your own.
There is also an example of this feature usage that you can try.
Among changes made to Qt Charts in Qt 6.2 there is a new feature that lets you display the best fit line for a QXYSeries and get the best fit line equation.
The another important feature added to the Qt Charts module is the light marker functionality added to QXYSeries that allows to set any image to be used to draw a point. It is a concept independent from normal points visibility. Both features can be enabled separately. This feature was implemented due to not-satisfying number of shapes that you can set to draw points.
This feature is demonstrated in one of the new examples – Light Markers Points Selection example.
The Qt Charts accessibility in Qt 6.1 on particular platforms stays the same. You can use the module to display data on charts regardless of your target platform. Your application using Qt Charts can be released on all desktop, mobile and embedded platforms supported by Qt.
The module is available under the commercial and open source (GNU GPL v3) licenses.
As you can see there are plenty of new features added to Qt Charts in Qt 6.2. Have in mind that not all of them were explained in this blog post. You should definitely start using points configuration feature in order to simplify your code and generally all the features to make your charts look more customized.
As for now, most of described additions to Qt Charts module were implemented to be supported only when implementing UI with Qt Widgets. We plan to make all those features accessible from the QML side as well.
Feel free to contact us if you feel the features of the Qt framework are insufficient for your needs. We are capable of extending the Qt framework for you as well as of custom Qt software development.
Some of the screenshots come from the official Qt Charts documentation.


Let's face it? It is a challenge to get top Qt QML developers on board. Help yourself and start the collaboration with Scythe Studio - real experts in Qt C++ framework.
Discover our capabilitiesToday’s medicine would not be in the same place if software-based solutions were not implemented into it. I’d be tempted […]

I wouldn’t lie when I say that a significant number of the projects carried out at Scythe Studio are related […]


Regular readers of our blog, know that we try to write posts on various topics related to programming in Qt […]