
Secure Boot and Firmware Protection in Embedded Systems
Users of embedded devices – from industrial controllers to consumer electronics – are often unaware of hidden vulnerabilities that threaten […]

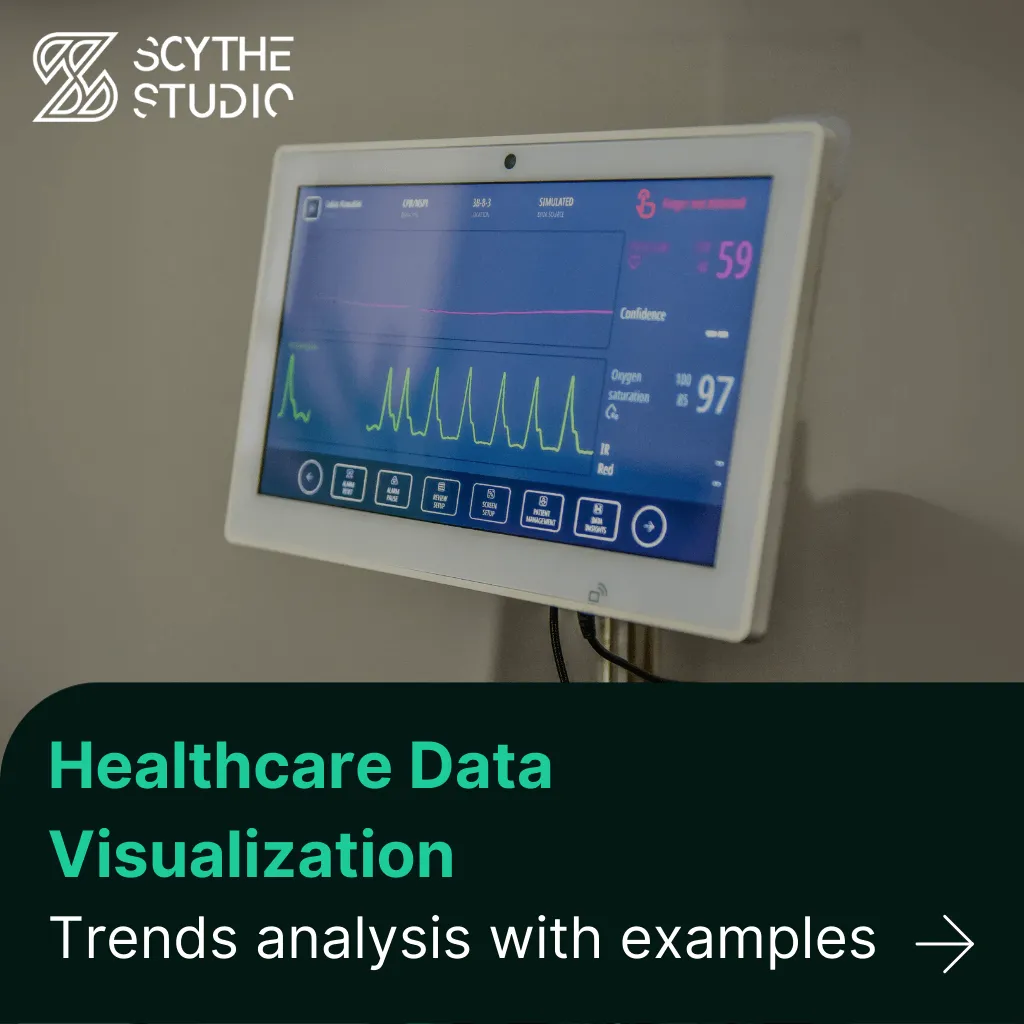
As the healthcare industry creates more and more healthcare data, the challenge is no longer just data collection but interpretation. Healthcare data visualization plays a crucial role in transforming patient data visualization into meaningful insights that enhance patient care, operational efficiency, and clinical decision-making.
At Scythe Studio, we create custom healthcare data visualization solutions that help medical device manufacturers integrate real-time data visualization into their products. Our data visualization tools allow healthcare professionals to make sense of raw data, so patient outcomes improve and decisions are informed.
Healthcare data visualization is the process of taking raw medical data and turning it into visual formats such as graphs, charts, heat maps and interactive dashboards. These tools allow clinicians, hospital administrators and researchers to see patterns, track patient progress and make decisions.
For medical device manufacturers, integrating powerful data visualization into their products can increase usability, giving healthcare professionals real-time insights and predictive analytics to measure treatment effectiveness and improve patient outcomes.
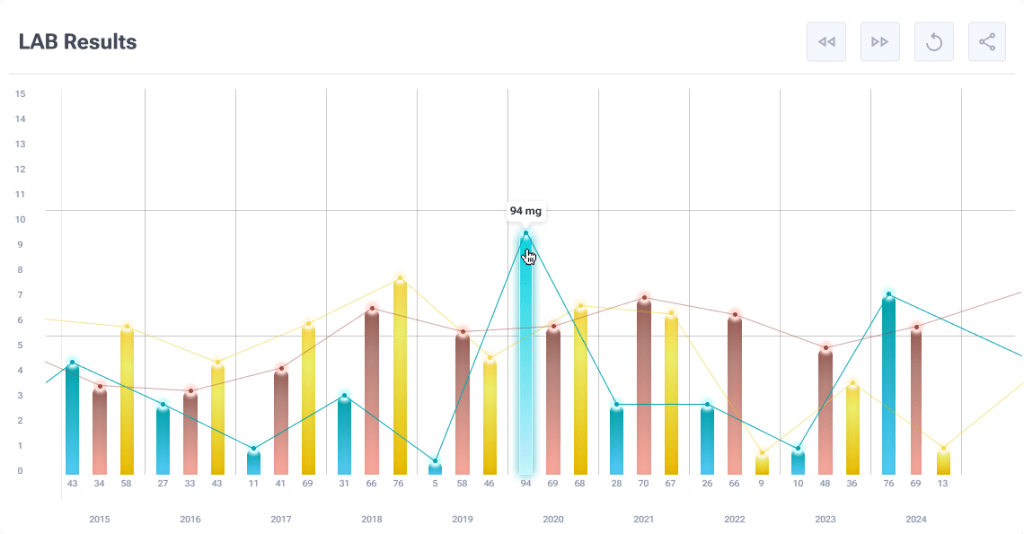
With the complexity of healthcare systems increasing, visual analytics is key to making complex data more accessible. Data visualization in healthcare means healthcare professionals can track patient health, see trends and optimize resource allocation.
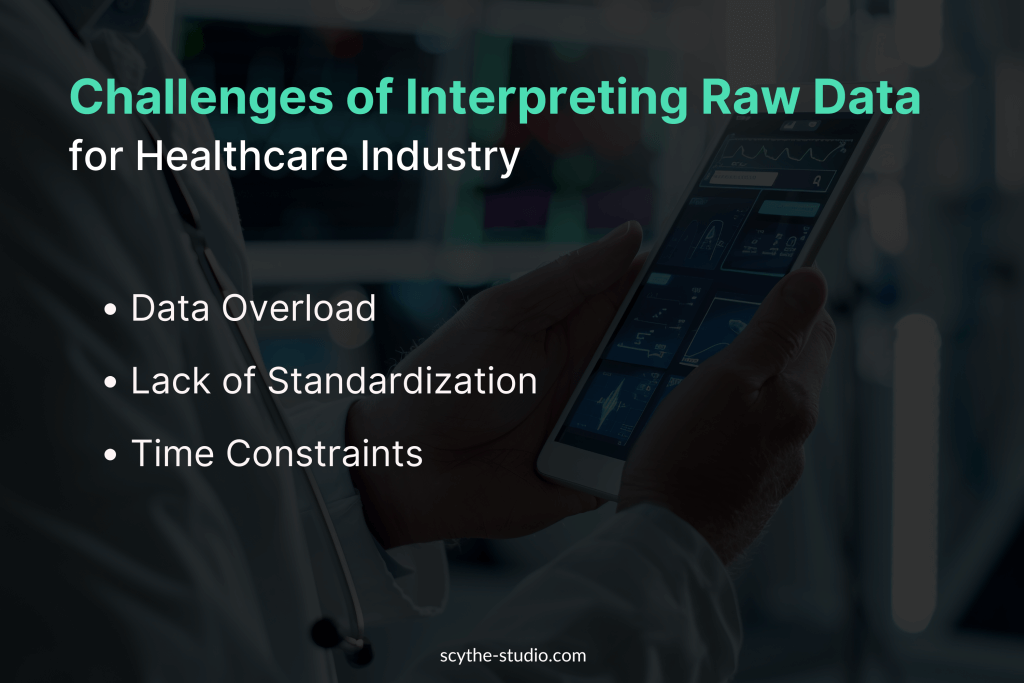
Despite the power of healthcare data visualization tools, there are challenges with data interpretation:
Data Overload – The healthcare industry generates massive amounts of patient data, making it hard to extract valuable insights quickly.
Lack of Standardization – Different data sources (medical billing systems, clinical research, wearables) use different formats, making data integration a challenge.
Time Constraints – Healthcare providers need real-time data visualization for quick analysis rather than waiting for reports.
The solution? Advanced visualization tools designed for fast data visualization so public health officials, researchers and clinicians can assess treatment progress and make decisions fast.
Healthcare data visualization turns complex medical information into clear, actionable insights, helping healthcare professionals make better decisions at every level. With advanced visualization tools, organizations can improve patient outcomes, optimize operations, and allocate resources more effectively.
1. Patient Monitoring and Diagnostics
Live visual dashboards allow clinicians to track vital signs (heart rate, oxygen saturation, blood pressure) and respond faster for better health outcomes.
2. Personalized Medicine Through Visualized Data
Analyzing health data from electronic health records (EHRs) and genetic testing, machine learning and data visualization helps treatment effectiveness to individual patients.
3. Real-Time Patient Data
Dashboards offer healthcare professionals instant access to patient data so they can see patterns and respond quickly.
1. Disease Outbreaks and Public Health Trends
Visualization tools help public health officials analyze geographic distribution and statistical analysis of diseases, so they can intervene early.
2. Chronic Disease Progression
For conditions like diabetes and cardiovascular disease, tracking treatment progress through data trends allows physicians to adjust treatment plans in real-time.
3. Demographic and Geographic Health Disparities
Analyzing multiple interactive reports, healthcare organizations can improve patient awareness and resource allocation to underserved areas.
1. Faster and More Accurate Diagnoses
AI-powered data analysis in medical imaging enables pattern recognition, allowing radiologists to detect anomalies with greater precision.
2. Risk Stratification and Predictive Analytics
Analyzing historical data, visualization tools can predict patient deterioration risks so clinicians can prioritize high-risk cases.
3. Visual Tools Aiding in Treatment Planning
3D healthcare visualization helps surgeons with preoperative planning so treatment is more effective and safer.
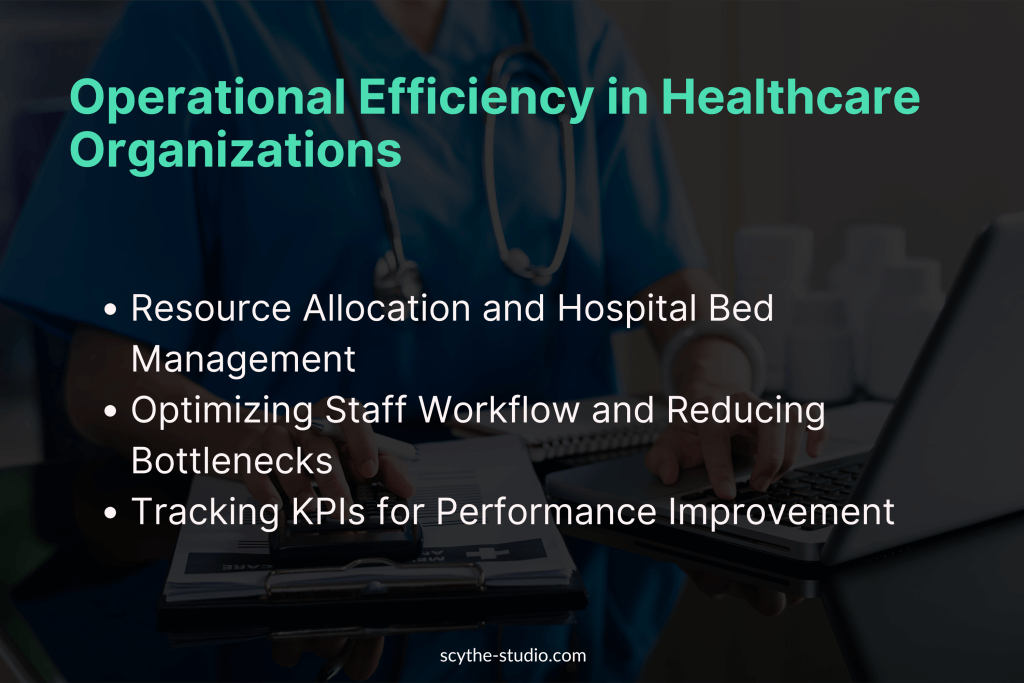
1. Resource Allocation and Hospital Bed Management
Live dashboards allow healthcare administrators to track hospital capacity, medical billing and patient flow in real-time.
2. Optimizing Staff Workflow and Reducing Bottlenecks
Analyzing real-time data, healthcare data visualization tools improve workforce efficiency and time management.
3. Tracking KPIs for Performance Improvement
From patient satisfaction scores to treatment outcomes, data visualization helps hospitals improve patient care and operational excellence.
1. Simplifying Complex Medical Information for Patients
Health data visualization makes it easier for patients to understand their condition, medications and treatment progress.
2. Visualizing Health Metrics for Patient Self-Care
Wearables offer interactive visualizations of personal health data so patients can be empowered and proactive with their health.
3. Infographics for Better Health Literacy
Graphic reports help patient education, making complex healthcare data easy to understand for non-technical people.
1. Billing Discrepancies and Insurance Fraud
Analyzing medical billing data helps identify fraudulent claims and save millions.
2. Medication Errors Through Visual Tracking
Real-time alerts in pharmaceutical dashboards ensure proper dosage and prevent adverse drug interactions.
3. Regulatory Compliance
Healthcare organizations can track HIPAA, GDPR and FDA compliance with secure, blockchain-backed data visualization tools.
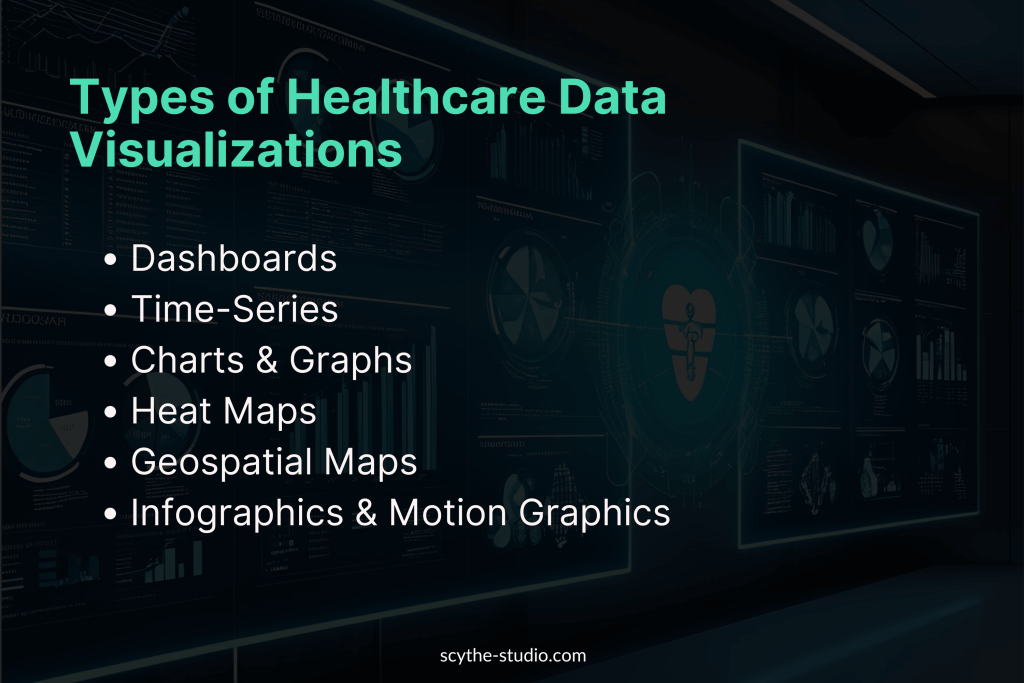
Dashboards – Real-time healthcare analytics for patient vitals.
Time-Series – Track data points over time for disease progression.
Charts & Graphs – Line graphs, bar charts and pie charts for complex numbers.
Heat Maps – Resource utilization and disease outbreak visualization.
Geospatial Maps – Public health planning and health disparities.
Infographics & Motion Graphics – Patient education and research data visualization.
C++ is one of the top choices for healthcare data visualization, thanks to its speed, efficiency, and ability to handle large datasets. It’s widely used by medical device manufacturers, researchers, and healthcare professionals to build powerful tools for real-time monitoring, predictive analytics, and medical imaging.
Why Choose C++ for Healthcare Data Visualization?
1. Speed and Performance
C++ processes large amounts of healthcare data incredibly fast, making it perfect for real-time dashboards and medical imaging software.
2. Seamless Integration with Medical Devices
Many medical devices already run on C++, so adding real-time visualization is smooth and hassle-free.
3. Powerful Graphics and High-Quality Rendering
With robust libraries, C++ enables the creation of high-resolution 2D and 3D medical visuals for better insights.
Want to know which tools work best for C++ data visualization? Check out our comparison of Qt Graphs vs. Qt Charts to see which one fits your project best.
Healthcare data visualization is rapidly evolving with new technologies that make it easier to interpret complex medical data. As the amount of healthcare data grows, innovative visualization methods help professionals quickly spot trends and make better decisions.
AI-powered analytics in medical devices help detect patterns, predict patient deterioration, and recommend treatments.
Advanced biometric monitoring devices enable real-time visualization for tailored treatment strategies.
Surgical AR-assisted displays and VR simulations help medical professionals visualize complex procedures before execution.
Blockchain technology ensures data integrity and security, reducing risks associated with tampered medical records.
Implementing Healthcare Data Visualization has its challenges—but you don’t have to face them alone. At Scythe Studio, we create custom data visualization solutions that help healthcare organizations make sense of complex medical data while ensuring security, compliance and efficiency.
Here’s how we can help you overcome key obstacles:
Data Integration & Interoperability – We consolidate fragmented healthcare data, so it’s seamless across EHRs, IoT devices and clinical systems.
Privacy & Security – Our solutions are HIPAA, GDPR and industry regulation compliant.
Data Overload & Bias – We make intuitive, easy to read visualizations to enhance decision making and reduce information overload.
Standardization of Healthcare Data Visualization – We ensure your data follows consistent visualization standards for reporting and analysis.
Data for Clinicians – We create user-friendly tools so medical professionals can use data insights without needing advanced analytics knowledge.
Need a partner to help with healthcare data visualization? Contact us!
Scythe Studio can turn your data into insights.


Let's face it? It is a challenge to get top Qt QML developers on board. Help yourself and start the collaboration with Scythe Studio - real experts in Qt C++ framework.
Discover our capabilitiesUsers of embedded devices – from industrial controllers to consumer electronics – are often unaware of hidden vulnerabilities that threaten […]

Graphical user interfaces (GUIs) are becoming more and more important in embedded devices – from home appliances to medical equipment […]

Technical managers in the embedded space often face a classic challenge: integrating industrial communication protocols into modern applications. One such […]
